Fritz Vahrenholt auf Frankfurt Live:
Wir schreiben das Jahr 2043
Was wird aus der Energiewende in den nächsten Jahren?Wir schreiben das Jahr 2043. Man kann sich gar nicht mehr nicht mehr richtig vorstellen, in welch verzweifelter Lage sich Deutschland in den Jahren 2023 bis 2029 befand. Ausgelöst war die Energiekrise bereits durch die verheerende Politik dreier Merkel-Regierungen, in denen die eigene Energieversorgung durch einen Ausstieg aus der Kernenergie und der Kohleverstromung eingeleitet wurde. Unter dem Einfluss der Grünen in der Regierung Scholz – an die man sich heute nur noch mit Schaudern erinnert – explodierten die Strompreise.
Die Regierung versuchte zwar mit Hilfe der öffentlich-rechtlichen Medien die Ursache hierfür dem Ukrainekrieg zuzuweisen. Doch spätestens nach der Beendigung des Krieges im Jahr 2024 wurde für jedermann offensichtlich: Es waren die eigenen Politiker, die durch eine Vervierfachung der CO2-Abgaben die Strompreise verdoppelt bis verdreifacht hatten sowie den Gebrauch von Gas zur Wärmeerzeugung sowie Benzin und Diesel für den Verkehr für die privaten und gewerblichen Verbraucher massiv verteuert hatten. Die Folge: Die Produktion der energieintensiven Industrie ging zunächst im Jahr 2023 um 25 Prozent und am Ende der Ampelregierung um 50 Prozent zurück. Das Steueraufkommen verringerte sich, der Wohlstand löste sich spürbar auf.
Weiterlesen auf Frankfurt Live
+++
Nicola Scafetta auf Climate Etc.:
“Realistic” global warming projections for the 21st century
My new paper demonstrates that realistic emissions scenarios and climate sensitivity values & scenarios of natural climate variability produce more realistic, non-alarming scenarios of 21st century climate.
I would like to thank Judith Curry for inviting me to write a short blog post on my just published paper:
Nicola Scafetta. Impacts and risks of “realistic” global warming projections for the 21st century. Geoscience Frontiers 15(2), 101774, 2024. https://doi.org/10.1016/j.gsf.2023.101774
The paper is open access and, therefore, it is accessible to all.
I believe the work is significant because it addresses the central issue that is of general interest: how much warming can we expect in the 21st century? These are serious challenges that scientists must solve to truly assist policymakers. Is today’s climate alarmism founded on real science, or is it simply an extrapolated view based on flawed arguments?
Answering such a question defines the steps that must be taken to address any expected threats associated with possible future climatic changes. However, the uncertainties are so great that no consensus can be reached. Some argue that we are on the verge of a massive climatic disaster if net-zero emission policies are not imposed quickly, while others argue that nothing will happen. Technically, anyone can present arguments in support of his or her belief because of the large uncertainties surrounding these climate change issues.
I’ve opted to address the issue by highlighting recent research efforts to reduce uncertainties in order to obtain more “realistic” climate estimates for the twenty-first century. This might then be used to better analyze the actual impacts and hazards of climate change, with the hope that people will be able to agree on the best remedies.
I have identified four sources of uncertainties:
Weiterlesen auf Climate Etc.
+++
JoNova am 27.12.2023:
Beijing has coldest December since records began 70 years ago
Beijing this month has had the coldest December since they started measuring the cold in 1951. Obviously, this is because of climate change. Any day now newspapers will start to call this the tragic inevitable result of man-made climate change, reminding us of how we need to send money to renewables, and immediately, or we’ll face so much more of this.
+++
Missing sea level rise in southeastern Greenland during and since the Little Ice Age
The Greenland Ice Sheet has been losing mass at an accelerating rate over the past 2 decades. Understanding ice mass and glacier changes during the preceding several hundred years prior to geodetic measurements is more difficult because evidence of past ice extent in many places was later overridden. Salt marshes provide the only continuous records of relative sea level (RSL) from close to the Greenland Ice Sheet that span the period of time during and since the Little Ice Age (LIA) and can be used to reconstruct ice mass gain and loss over recent centuries. Salt marsh sediments collected at the mouth of Dronning Marie Dal, close to the Greenland Ice Sheet margin in southeastern Greenland, record RSL changes over the past ca. 300 years through changing sediment and diatom stratigraphy. These RSL changes record a combination of processes that are dominated by local and regional changes in Greenland Ice Sheet mass balance during this critical period that spans the maximum of the LIA and 20th-century warming. In the early part of the record (1725–1762 CE) the rate of RSL rise is higher than reconstructed from the closest isolation basin at Timmiarmiut, but between 1762 and 1880 CE the RSL rate is within the error range of the rate of RSL change recorded in the isolation basin. RSL begins to slowly fall around 1880 CE, with a total amount of RSL fall of 0.09±0.1 m in the last 140 years. Modelled RSL, which takes into account contributions from post-LIA Greenland Ice Sheet glacio-isostatic adjustment (GIA), ongoing deglacial GIA, the global non-ice sheet glacial melt fingerprint, contributions from thermosteric effects, the Antarctic mass loss sea level fingerprint and terrestrial water storage, overpredicts the amount of RSL fall since the end of the LIA by at least 0.5 m. The GIA signal caused by post-LIA Greenland Ice Sheet mass loss is by far the largest contributor to this modelled RSL, and error in its calculation has a large impact on RSL predictions at Dronning Marie Dal. We cannot reconcile the modelled RSL and the salt marsh observations, even when moving the termination of the LIA to 1700 CE and reducing the post-LIA Greenland mass loss signal by 30 %, and a “budget residual” of mm yr−1 since the end of the LIA remains unexplained. This new RSL record backs up other studies that suggest that there are significant regional differences in the timing and magnitude of the response of the Greenland Ice Sheet to the climate shift from the LIA into the 20th century.
+++
Die US-amerikanische Wetter- und Ozeanbehörde NOAA erstellt regelmäßige Waldbrandstatistiken für die USA. Hier die Statistik für Juni 2023:
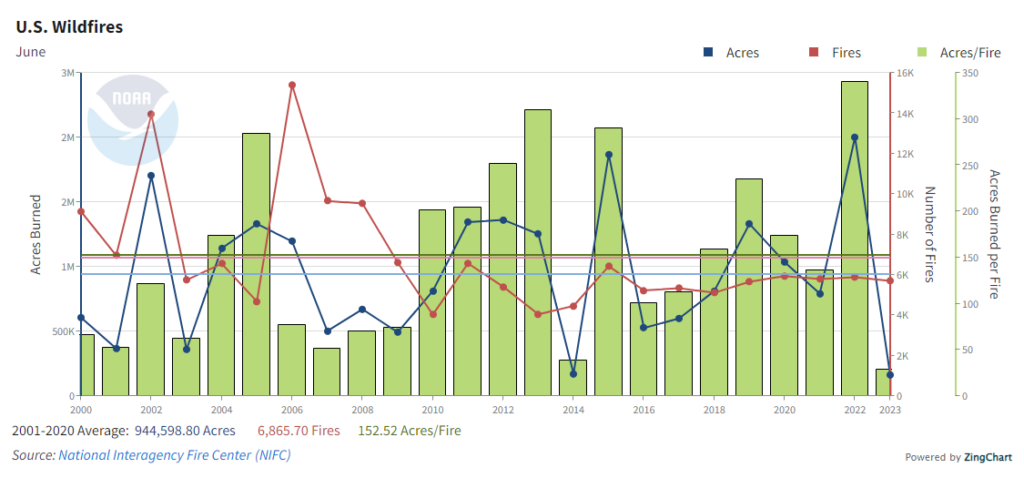
In blau ist die verbrannte Fläche gezeigt. 2023 wird ein absoluter Tiefpunkt im 21. Jahrhundert erreicht. Auch die Anzahl der Brände liegt unter dem Durchschnittswert.
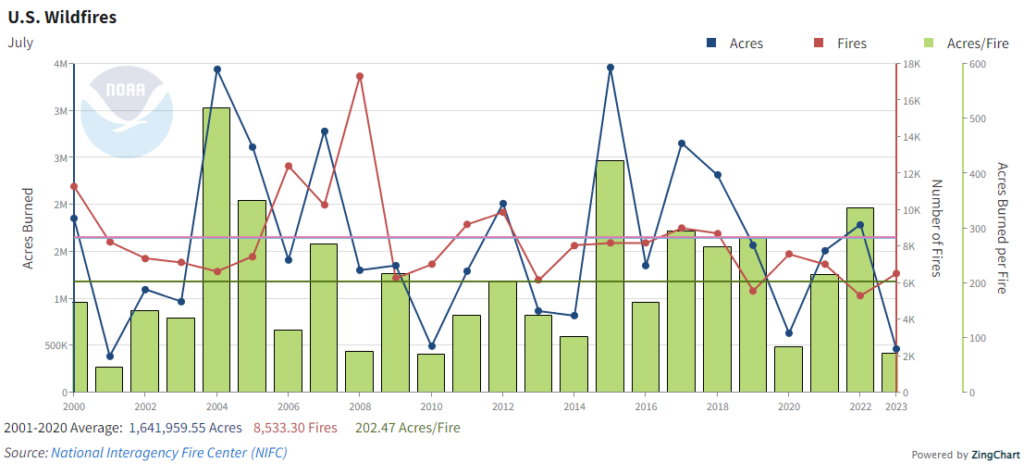
Und so ging es im Juli 2023 weiter:
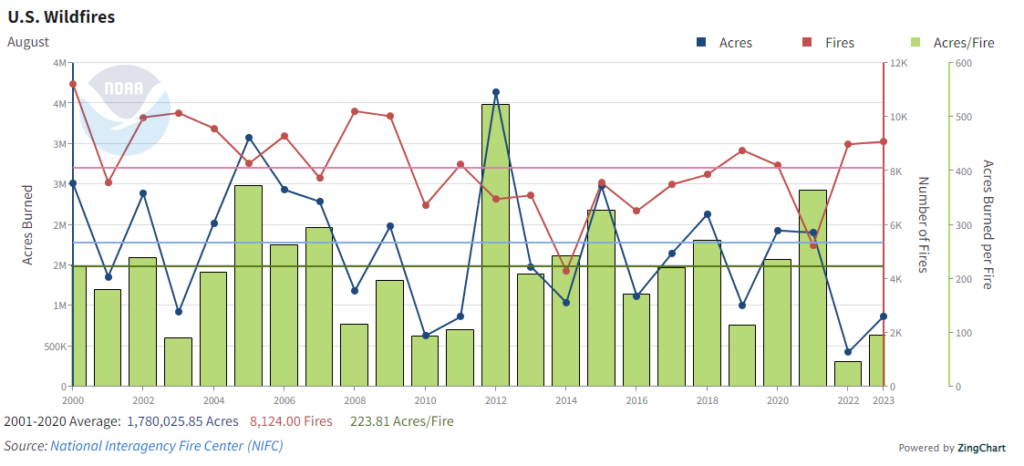
Im August 2023 gab es relativ viele Brände, aber die verbrannte Fläche war recht gering:
Zum Abschluss noch der letzte warme Monat September:
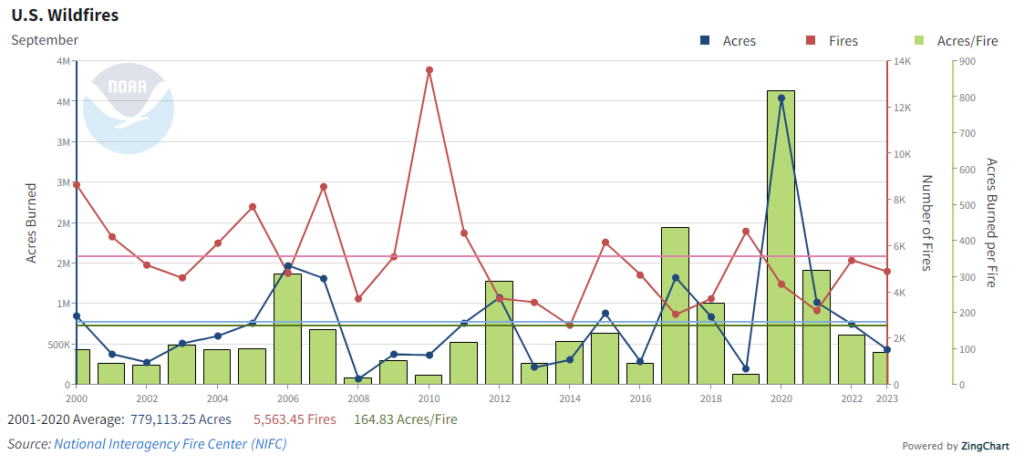
Von diesen recht positiven Entwicklungen hört man in den Medien leider nichts. Zum Glück gibt es die KlimaNachrichten!
