
Früher vor dem Klimawandel war alles besser? Pustekuchen. Uni Kiel:
In einer frühmittelalterlichen Siedlung lauerten gefährliche Krankheitserreger hinter jeder Ecke
- DNA aus 1300 Jahre alten Skeletten erlaubt Analyse des Gesundheitszustands einer merowingerzeitlichen Gemeinschaft
- Studie ergibt hohe Infektionshäufigkeit mit verschiedenen Erregern
- Ergebnisse lassen auch allgemeine Schlüsse auf Anfälligkeit für Infektionen in Zeiten klimatischer Änderungen zu
Mangelnde persönliche Hygiene, krankheitsübertragende Ratten und allgemeine ungesunde Lebensumstände – das Mittelalter wird gemeinhin als ein Zeitalter allgegenwärtiger Krankheiten angesehen. Der größte Teil unseres Wissens über mittelalterlichen Epidemien bezieht sich allerdings auf das Spätmittelalter nach dem 12. Jahrhundert n. Chr. Im Gegensatz dazu sind die Infektionshäufigkeit im Frühmittelalter sowie die Erreger, die für die Krankheitsausbrüche dieser Zeit verantwortlich waren, noch weitgehend unerforscht. Ein interdisziplinäres Forschungsteam unter der Leitung von Wissenschaftlerinnen und Wissenschaftlern der Christian-Albrechts-Universität zu Kiel hat jetzt mit neuesten Analyse-Techniken für alte DNA Hinweise für eine hohe Belastung durch Infektionskrankheiten in der frühmittelalterlichen Siedlung Lauchheim „Mittelhofen“ (Baden-Württemberg) gefunden. Die Studie erscheint heute in der internationalen Fachzeitschrift Genome Biology.
Analyse offenbart verschiedene Krankheitserreger in den Skeletten
Die Forscherinnen und Forscher konnten für die Studie DNA aus 70 menschlichen Skeletten isolieren, welche innerhalb der Siedlung bestattet wurden. Die Gräber liegen in der Nähe von Gehöften und wurden in die späte Merowingerzeit (7.-8. Jahrhundert n. Chr.) datiert. „Die Analyseergebnisse zeigen, dass die Bewohner an Infektionen mit verschiedenen Krankheitserregern litten, darunter das Mycobacterium leprae, das Hepatitis-B-Virus, kurz: HBV, das Parvovirus B19 und das Variola-Virus VARV“, berichtet der Leiter des Forschungsteams, Prof. Dr. Ben Krause-Kyora vom Institut für klinische Molekularbiologie der CAU.
Die in Lauchheim nachgewiesenen Infektionserreger verursachen sowohl chronische als auch akute Erkrankungen unterschiedlichen Schweregrades. Eine Infektion mit M. leprae kann zur Entwicklung einer hartnäckigen und stark beeinträchtigenden Lepra führen. Die Symptome einer HBV-Infektion reichen von leichten Bauchschmerzen und Fieber bis hin zu Leberfibrose und sogar Leberkrebs. B19 scheint weniger gefährlich zu sein, da die Infektion in der Regel asymptomatisch verläuft und schwere Komplikationen selten sind.
Im Gegensatz dazu verursachte das Variola-Virus bis zur seiner Ausrottung im Jahr 1980 die Pocken – eine akute Krankheit mit hoher Sterblichkeit. „Aufgrund der genetischen Unterschiede zwischen dem modernen und dem mittelalterlichen VARV können wir jedoch nicht sagen, wie die Symptome der Infektion im Mittelalter aussahen und ob der Erreger so gefährlich war wie das moderne Variola-Virus“, so Prof. Dr. Krause-Kyora.
Viele Menschen litten sogar unter mehreren Infektionen
Die Autorinnen und Autoren stellten eine erhebliche Anzahl von Koinfektionen mit zwei oder sogar drei verschiedenen Erregern fest. Insgesamt konnten bei 31 Prozent der untersuchten Individuen genetische Spuren von mindestens einem Erreger gefunden werden. „Obwohl diese Zahl sehr hoch ist, spiegelt sie nicht die Krankheitslast zu einem bestimmten Zeitpunkt wider. Die Datierung der Gräber deutet darauf hin, dass das Gräberfeld etwa ein Jahrhundert lang genutzt wurde, also drei bis vier Generationen. Das muss bei der Interpretation berücksichtigt werden“, so Joanna Bonczarowska vom Institut für klinische Molekularbiologie der CAU, Erstautorin der Studie.
Dennoch glauben die Forscher, dass ihre Berichte die wahre Häufigkeit der Infektion in Lauchheim wahrscheinlich unterschätzen. Krause-Kyora erklärt das so: „Wenn alle Weichteile zerstört sind, können in den Knochen nur noch durch Blut übertragene Krankheitserreger zuverlässig nachgewiesen werden. Berücksichtigt man diese Einschränkung zusammen mit dem Abbau von DNA-Molekülen, der im Laufe der Zeit stattfindet, blieben einige Infektionen wahrscheinlich unentdeckt.“
Allgemein schlechter Gesundheitszustand und klimatischer Wandel
Die frühmittelalterlichen Menschen in Lauchheim waren im Allgemeinen in einem schlechten Gesundheitszustand, da ihre Skelette Anzeichen von Infektionen und/oder einer unzureichenden Ernährung aufwiesen. Eine der Hauptautorinnen, Prof. Almut Nebel vom Institut für klinische Molekularbiologie der CAU, erklärt: „Zu dieser Zeit erlebte Europa einen rapiden Klimaverfall, der als spätantike kleine Eiszeit bekannt ist. Klimaveränderungen können zu Ernteausfällen und schließlich zu Hungersnöten führen“. Die Unterernährung erhöhte möglicherweise den physiologischen Stress der Menschen. „Theoretisch würde eine Hungersnot die unterernährte Bevölkerung schwächen und die Verbreitung von Krankheitserregern in der Gemeinschaft erleichtern. Diese Menschen waren in einem sehr schlechten Gesundheitszustand, und die Bedingungen schienen die Ausbreitung von Krankheiten und die Entwicklung von Krankheitserregern zu begünstigen“, fügt Professorin Nebel hinzu.
Die Studie bietet eine neue Perspektive auf die Belastung durch Infektionskrankheiten in einer Gemeinschaft, welche in einer Zeit lebte, die durch eine hohe Exposition gegenüber Krankheitserregern, einen raschen kulturellen Wandel und große klimatische Veränderungen gekennzeichnet war. Diese Bedingungen lassen sich bis zu einem gewissen Grad auf die heutige Zeit übertragen – in Zeiten neu aufkommender, wieder zurückkehrenden Infektionskrankheiten und des Klimawandels.
„Diese Studie ist darüber hinaus eine gutes Beispiel für die Zusammenarbeit verschiedener Disziplinen an der CAU. Hier sind Expertise und Mittel des Sonderforschungsbereichs 1266, des Exzellenzclusters ROOTS und des Exzellenzclusters Präzisionsmedizin zusammengekommen, um mehr über die Geschichte der menschlichen Krankheiten zu erfahren und daraus mögliche Lehren für uns heute zu ziehen“, resümiert Ben Krause-Kyora.
Paper: Bonczarowska et al.: Pathogen genomics study of an early medieval community in Germany reveals extensive co‑infections. Genome Biology, https://doi.org/10.1186/s13059-022-02806-8
+++
Correctiv steht fest auf der Seite der Klimaalarmisten. Vor kurzem versuchte Correctiv die vorindustriellen Temperaturschwankungen kleinzureden. Peinlich.
+++
Und täglich grüßt das Murmeltier. Stefan Rahmstorf ist wie ein Boxer. Seine Kollegen zerlegen regelmäßig seine Golfstrom-Kollaps-Prognose, trotzdem bringt er seine Idee immer wieder in Medien und Papers unter. So etwas nennt man beratungsresistent. Die Süddeutsche Zeitung hat es nun gewagt, die Kritik am Golfstrom-Kollaps-Modell öffentlich zu machen:
Klimawandel: Kritik an Studie zu Golfstrom-Kollaps
Schon Mitte dieses Jahrhunderts werde der Golfstrom zusammenbrechen, warnen zwei dänische Wissenschaftler. Doch andere Experten widersprechen. Wie nah ist der Kipppunkt?
Auch der SWR titelte kritisch:
MÖGLICHE FOLGE DES KLIMAWANDELS: Umstrittene Studie: Kollaps des Golfstroms schon 2050
Der Golfstrom sorgt bei uns für milde Temperaturen und hält als Teil des Golfstrom-Systems unser Klima in der Balance. Jetzt kommt eine neue Studie zum Schluss, dass der Golfstrom zum Erliegen kommen könnte – und zwar schon zur Mitte des Jahrhunderts. An der Arbeit gibt es aber auch Kritik.
+++
NASA:
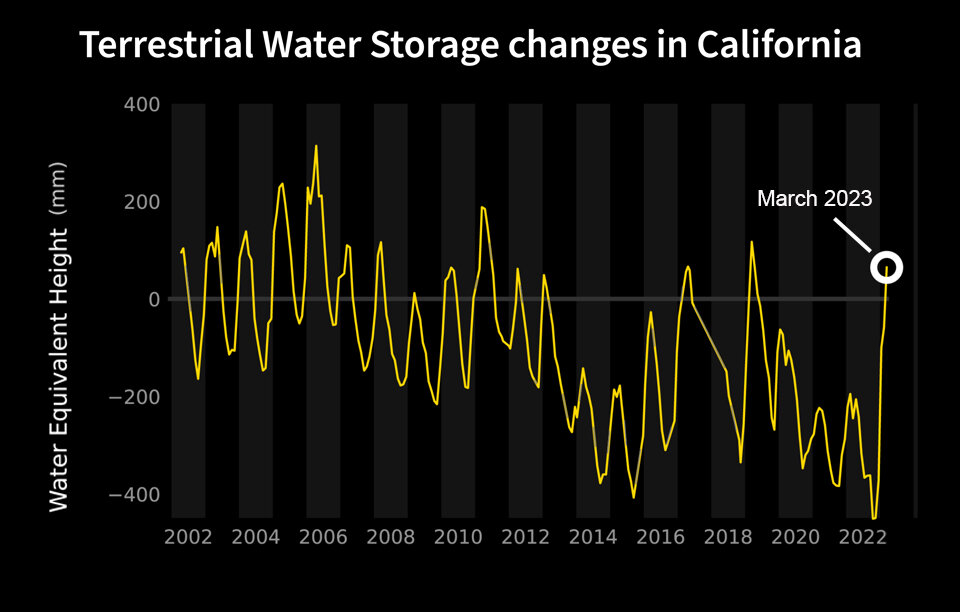
US-German satellites show California water gains after record winter
Early data show the greatest net gain of water over the winter in nearly 22 years, but the state’s groundwater levels still suffer from the effects of years of drought.
After years of intense drought and diminishing groundwater, California just saw its greatest year-over-year water gains in two decades, according to data from the GRACE-FO (Gravity Recovery and Climate Experiment Follow-On) satellite mission, a partnership between NASA and the German Research Centre for Geosciences (GFZ). This past winter’s bonanza of atmospheric rivers alleviated some of the water deficit that the state incurred during periods of drought over the last 10 years, which included the three driest years on record in California.
Think of the state’s Central Valley region (outlined in yellow, above) as a giant swimming pool: GRACE-FO measurements include all the water contained in the lakes, rivers, soil, snowpack, and underground aquifers within that region.
Between October 2022 and March 2023, storms provided enough water to raise the amount of water within the „swimming pool“ by about 20 inches (about 500 millimeters). That’s about twice as much as the average winter water gain since satellite-based water storage measurements began in 2002 with the first GRACE mission.
While surface water basins are filling, underground stores of fresh water (aquifers) that are tapped for irrigation and other needs could take years to fully recharge. „One good winter of rain and snow won’t make up for years of extreme drought and extensive groundwater use,“ said Felix Landerer, GRACE-FO project scientist at NASA’s Jet Propulsion Laboratory in Southern California.
The GRACE-FO team will continue to track how California’s water storage evolves through the summer after the snowpack melts and water levels in the state’s lakes, rivers, and reservoirs start to recede during drier weather.
The observations were made possible through the unique sensing approach taken by both GRACE missions. As water moves around—in the form of ocean currents, falling rain, shifting groundwater, ice, and so on—it alters the planet’s mass near the surface, which changes Earth’s gravitational pull ever so slightly. GRACE-FO measures these subtle changes, enabling researchers to estimate changes in the total volume of water in an area.
Like its predecessor, the GRACE-FO mission consists of two identical satellites that fly one behind the other. As the lead satellite flies over an area with greater mass—such as an area with more water than another region—the slight change in gravity tugs it forward, increasing the distance between the two satellites. Microwave and laser instruments aboard the spacecraft precisely measure the minute distance changes between the two, revealing details about the overall mass of water that caused those changes.
+++
Order in chaos: Atmosphere’s Antarctic oscillation has natural cycle, discover researchers
Climate scientists at Rice University have discovered an „internally generated periodicity“—a natural cycle that repeats every 150 days—in the north-south oscillation of atmospheric pressure patterns that drive the movement of the Southern Hemisphere’s prevailing westerly winds and the Antarctic jet stream.
„This is something that arises from the internal dynamics of the atmosphere,“ said Pedram Hassanzadeh, co-author of a study about the discovery in the open-access journal AGU Advances. „We were playing with some new equations that we had derived for the atmosphere’s turbulent circulation, and we found they predicted the possibility of natural periodicity in the Southern Annular Mode (SAM). We were skeptical, but we went to the observational data and we actually found it.“
Co-author Sandro Lubis said, „It was really a surprise, because it goes against the conventional wisdom that the atmosphere is all chaos and disorganization.“
The SAM, which is also known as the Antarctic oscillation, is an important climate driver for Australia, New Zealand and Antarctica and has been well-studied for decades.
„It has been very important to the climate community,“ said Hassanzadeh, an assistant professor of mechanical engineering and of Earth, environmental and planetary sciences at Rice. „People always look at the SAM because it affects so much in the Antarctic: the ice, the ocean, the ozone layer, almost everything. But the oscillations, which you can see in the north-south movements of the jet stream winds, happen randomly with timescales of 10-20 days.“
It was surprising to find that a simultaneous, organized oscillation occurs 10 times more slowly, he said, but the periodicity of the slower oscillation was even more surprising.
Lubis, a research scientist at Pacific Northwest National Laboratory and former postdoctoral research fellow in Hassazadeh’s lab at Rice, said the 150-day oscillation clearly influences the variability of the hemispheric-scale precipitation and ocean surface wind stress, which suggests it could have broader impacts on the weather and climate of the Southern Hemisphere and its ocean and cryosphere.
Hassanzadeh and Lubis each said the paper’s biggest impact will likely be in the arena of climate modeling.
„Significantly, we found that many state-of-the-art climate models cannot reproduce this periodicity,“ Lubis said. „This helps explain some of the previously reported shortcomings of these models in simulating the SAM variability. Based on those findings, we were able to propose new metrics and ideas for evaluating how well climate models simulate the SAM and for understanding their shortcomings and potentially improving them.“
The jet stream results from two large-scale features of Earth’s atmospheric circulation, the tendency for air to sink in the subtropics, about 30 degrees latitude north or south of the equator, and to rise as it nears the pole, around 60 degrees latitude. Where air sinks, pressure increases and areas of high pressure develop. Where air rises, pressure drops, resulting in areas of low pressure.
The mid-latitudes between the 60th and 30th parallels, in both hemispheres, are therefore bounded by globe-wrapping bands of low pressure on their poleward sides and high pressure on their subtropical sides. The low pressure zones correspond with strong upper-level winds known as the polar jet stream, which trace almost circular, or annular, paths around the poles.
The polar jet stream around Antarctica regularly migrates between southerly tracks that hug the icy continent and northerly tracks that cross or come near Australia, South Africa and South America. These north-south oscillations typically last about two weeks, but their timing and duration are random.
The oscillations correspond with balanced air pressure anomalies of one sign near the 60th parallel and the opposite sign near the 30th parallel. The SAM is a statistical index of these anomalies, which oscillate in a seesaw pattern, rising and falling on opposing boundaries as the westerlies move north and south.
When the SAM index is positive, the jet stream is enhanced and cold air stays bottled up around the pole. When the index is negative, atmospheric lows—and rain and storms—are more frequent in the mid-latitudes.
Hassanzadeh said the discovery of the SAM’s 150-day periodicity came from rethinking the conventional mathematical and statistical approaches to understanding atmospheric circulation.
„For whatever you’re interested in, like wind or temperature, you can reduce it to the leading pattern, the second leading pattern, the third leading pattern, and so on,“ he said. „And the way this statistical analysis, called principal component analysis, has been done, the patterns are all supposed to be independent of one another.“
Based on previous studies by other groups, Hassanzadeh and Lubis thought, some of the patterns might be dependent at some lag times.
„We relaxed some of the assumptions, created a new mathematical model and then wrote a very technical paper showing that it was a better model,“ Lubis said. „And at some point we looked at the model and said, „This says there is a periodicity. Of course, that cannot be right! But let’s go to the data and look.'“
Hassanzadeh said the 150-day periodicity occurs because the SAM’s leading patterns of north-south movements are not independent. Rather, they interact with and are acted upon by other leading wind patterns.
„The leading pattern is the SAM, the regular movement of the jet to the north or south,“ Hassanzadeh said. „The second pattern is the jet stream becoming faster or slower. The way this periodicity works is that the first pattern, the SAM, reinforces itself and makes itself stronger. And the second pattern also makes the SAM stronger. But then, when the SAM becomes very strong, it starts reducing the second pattern, which in turn reinforces the SAM less.“
Hassanzadeh said the next step in the research is investigating why some state-of-the-art climate models fail to capture those interactions and the 150-day periodicity of the SAM.
„In the long run, our hope is that this new knowledge will help improve model accuracy for climate change projections,“ he said.
Paper: Sandro W. Lubis et al, The Intrinsic 150‐Day Periodicity of the Southern Hemisphere Extratropical Large‐Scale Atmospheric Circulation, AGU Advances (2023). DOI: 10.1029/2022AV000833