Ob diese Haltung Klima-Aktivisten gefällt? Der neue IPCC-Chef Skea scheint kein Freund von Untergangsszenarien zu sein. Die Süddeutsche zu der Personalie:
“Er habe mit Koautoren bei den jüngsten Berichten des Weltklimarats immer Wert darauf gelegt, den „Silberstreif am Horizont“ zu sehen. Die Technologien und Instrumente, um den Klimawandel einzudämmen seien vorhanden, sie müssten nur auch angewendet werden. „Die Zukunft des Menschen liegt in unserer Hand. Nutzen wir das“, sagte Skea (69).
Mit der Wahl des Professors für nachhaltige Energie an der Londoner Eliteuniversität Imperial College beginnt der siebte Sachstandszyklus des Weltklimarats (IPCC). Der Rat ist eine UN-Institution in Genf. Für ihn tragen Fachleute den wissenschaftlichen Kenntnisstand zum Klimawandel alle fünf bis sieben Jahre zusammen. Sie zeigen Handlungsoptionen und ihre jeweiligen Konsequenzen auf.”
“Der neue Vorsitzende des Weltklimarates, Jim Skea, hält nichts von Untergangsszenarien im Zusammenhang mit dem Klimawandel. „Wenn man ständig nur die Botschaft aussendet, dass wir alle dem Untergang geweiht sind, dann lähmt das die Menschen und hält sie davon ab, die nötigen Maßnahmen zu ergreifen, um mit dem Klimawandel fertig zu werden“, sagte Skea wenige Tage nach seiner Wahl im Gespräch mit der dpa.”
+++
Stromleitungen werden zum Problem für Erneuerbare: Experte sieht diese Lösung. E-Fahrer zu dem Thema:
“Das Nadelöhr der Energiewende sind zweifelsohne die Stromnetze. Während die Bundesregierung den Ausbau von Wind- und Solarenergie vorantreibt, bleibt der Netzausbau hinter den Erwartungen zurück. Das Bundeswirtschaftsministerium prognostiziert den Bedarf von knapp 14.000 Kilometer neuen Stromnetzen, doch bisher sind nur etwa 1.900 Kilometer umgesetzt worden.
Während sich der Strombedarf bis 2045 voraussichtlich verdoppeln wird, sind die Netze für die Integration von Windrädern und Solaranlagen unverzichtbar. Wie der Tagesspiegel berichtet, führt dieses Ungleichgewicht zu Verzögerungen und Engpässen in der Energiewende.”
“Die Stromnetze in Deutschland stehen mehr und mehr vor einer Belastungsprobe: Einerseits wird immer mehr Strom verbraucht, etwa durch Wärmepumpen oder Ladesstationen für Elektroautos. Gleichzeitig wird durch private Photovoltaikanlagen auch immer mehr Strom massenweise dezentral produziert. Folge: Die Verteilnetze, beispielsweise die Stromleitungen, die auf den letzten Metern die Haushalte versorgen, sind für die immer größeren Strommengen häufig einfach zu dünn.”
+++
Die Demission von Patrick Graichen scheint bei der FDP nicht unbedingt Traurigkeit auszulösen. Der Tagesspiegel berichtet über die neuen Wasserstoff-Pläne der Bundesregierung.
“Der Liberale benennt auch jene Akteure, die aus seiner Sicht diesen Ansatz immer wieder vorangetrieben haben. „Zu lange“, so Dürr, „hat die Politik, im übrigen auch die unionsgeführte Bundesregierung, unter dem Einfluss von Organisationen wie Agora und anderen auf All Electric gesetzt.“
Die Ausrichtung der Denkfabrik Agora Energiewende hat die Arbeit im Bundesministerium für Wirtschaft und Klimaschutz zeitweise mindestens mitgeprägt. Schließlich berief der Wirtschaftsminister dann Patrick Graichen, den Mitgründer und langjährigen Leiter der Lobbyorganisation für die Energiewende, bei Regierungsantritt im Dezember 2021 zu seinem Staatssekretär. Nur widerwillig entließ ihn der grüne Minister vor gut zwei Monaten im Zuge der sogenannten Trauzeugenaffäre.”
Stichwort Wasserstoff. Lingen scheint ein Zentrum für Wasserstoff zu werden. En-Former, der Energieblog von RWE über die Entwicklung.
“Um die steigende Nachfrage zu decken, ist nicht nur ein Anstieg in der Produktion, sondern insbesondere auch ein Ausbau der nötigen Infrastruktur wichtig. Deshalb ist es gerade in der Hochlaufphase der Wasserstoffwirtschaft essenziell, Projekte auf sogenannte Wasserstoff-Zentren zu konzentrieren, an denen gute Voraussetzungen für eine vollständige H2-Wertschöpfungskette gegeben sind. In Deutschland entwickelt sich die Region Emsland rund um die Stadt Lingen zu einem solchen Zentrum. Hier laufen viele Stränge für Erzeugung, Transport und Nutzung von grünem Wasserstoff zusammen.
RWE setzt unter anderem am Standort des Gaskraftwerks Emsland mehrere zentrale Wasserstoffprojekte um und auch andere Unternehmen aus der Energiewirtschaft und Industrie planen H2-Aktivitäten in der Region. Dabei werden alle Phasen der Wertschöpfungskette abgebildet.”
+++
Die weltweite Nachfrage nach Kohle hat in 2022 auf einen neuen Rekordwert zugenommen. Hauptteiber ist China. Supplychainbrain:
“Global coal consumption grew by 3.3% to a record-setting 8.3 billion tons (bt) in 2022 with levels expected to increase once again in 2023. In a new report released by the International Energy Agency (IEA) July 27, entitled “Coal Market Update,” the global demand for coal increased due to the commodity being relatively cheaper and more readily available than gas in certain parts of the world.
Coal demand in China grew by 4.6% in 2022 to a new all-time high of 4.519 bt, beating estimations recorded in the IEA’s 2022 Coal Report. Demand in India grew by more than 8% to 1.155 bt fueled by the country’s economic growth in 2022, making it the only nation besides China to surpass the 1.1 bt mark.
The EU only experienced a slight demand increase of 0.9% in 2022, topping out at 488 million tons (mt). However, the IEA, an intergovernmental organization that provides data and analyses of the entire global energy sector,expects the EU’s full-year coal demand to fall by 17% in 2023.
Demand in the U.S. fell by 7% to 457 mt during 2022 because of weak electricity needs coupled with a growing renewable energy sector. The IEA predicted that demand in the U.S. would fall by 24% during the first half of 2023 and drop to 357 mt for the full year.”
Alle Mitarbeiter des PIK haben in den letzten Jahre dutzende von Beiträgen mit „Katastrophen Prognosen“ abgeliefert, nichts, aber auch garnichts daran stimmte, so wird es auch diesmal mit dem Wirbel um AMOC sein, es ist schon enorm gekonnt, wie es einem gelingen kann, sich mit wissenschaftlich formulierten Behauptungen bekannt machen.
Patrick Moore gibt auf Twitter eine fundiertere Erklärung: „Die Zeitschrift „Lancet“ veröffentlichte das Diagramm links mit ungleicher X-Achse*, um die Tatsache herunterzuspielen, dass Kälte zehnmal mehr Todesfälle als Hitze verursacht … Das ist eine Schande für eine angeblich wissenschaftliche Zeitschrift.“
eine Anmerkung zum ADAC-Test: Die vom ADAC vermeldeten Ergebnisse sollen wohl Hoffnung bei E-Autofahrern machen. Nur, wer fährt schon mit voller Batterie oder vollem Tank in einen Stau? Und was nützt mir die Restladung von 15% oder 20% Prozent, wenn viele E-Autos auch mit dieser Restladung nicht mehr anspringen, wie ein Test ergab!
Canada is already Net Zero Greenhouse Gas Emissions
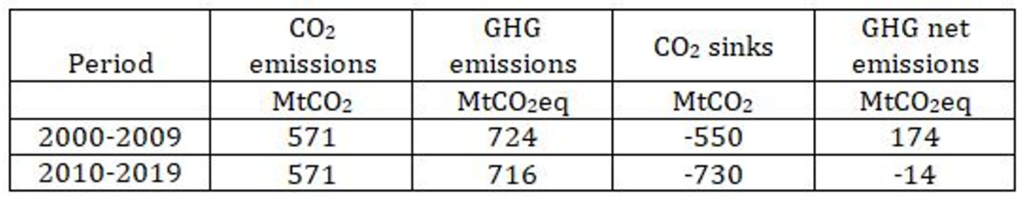
A recent paper provided estimates of carbon sinks in North America. The authors used an ensemble of 19 state-of-the-art dynamic global vegetation models to improve carbon land sink estimates and study the drivers of its variability. In Canada, the carbon sink increased from 550 MtCO2/yr during 2000-2009 to 730 MtCO2/yr during 2010-2019. During the same periods, Canada’s average annual emissions of greenhouse gases (GHG) were 724 MtCO2eq and 716 MtCO2eq, respectively. The table below shows the CO2 and GHG emissions, CO2 sinks and the net GHG emissions.
Canada’s emissions have been declining while the absorption of CO2 into land sinks has increase by 33% between the two decades. During the 2010-2019 decade, Canada’s net GHG net emissions were -14 MtCO2eq., meaning that emissions were less than that captured by carbon land sinks. Canada has likely already surpassed net zero GHG emissions. See our June newsletter, for more information.
+++
CMCC Foundation – Euro-Mediterranean Center on Climate Change:
Interdisciplinary study provides a detailed map of urban heat islands
Urban areas are where the majority of the world’s population lives, and they are also usually most affected by climate change. Heat waves and extreme temperatures are more intense in heavily-built areas, intensifying existing weaknesses and inequalities among the urban population.
An interdisciplinary study published in Urban Climate and led by the CMCC Foundation focuses on the Urban Heat Island phenomenon, providing a reproducible and flexible methodology to explore the risk assessment on the heat-health nexus within the city of Turin, Italy.
The Urban Heat Island (UHI) is defined as a temperature difference between urban and rural areas, caused by the excess of heat emitted and by the solar gain trapped by the urbanized environment.
„The UHI phenomenon is typical of urban areas and it is stronger during heat waves events,“ said Marta Ellena, of the CMCC’s REgional Models and geo-Hydrological Impacts (REMHI) division, and first author of the paper. „This happens because cities are mostly covered by impermeable surfaces, and this makes temperatures higher, worsening the already existing UHI effect.“
The main objective of the study was to produce climate risk assessment evaluations at the local scale taking under consideration the main drivers of inequality, which are crucial for suggesting adaptation strategies for more climate-resilient and sustainable cities.
An important feature of the study was the identification of the UHI risk per census tract, which is the minimum geographical entity of data collection currently available from Italian municipalities. „This is one of the most innovative aspects of this work,“ said Ellena, „because previous studies considered city’s quarters or districts. For example, Turin has 23 quarters and 8 districts: in this study we considered its census tracts, which are 3843, so it is an enormous set of information, especially compared to previous studies.“
The research was carried out adopting an up-to-date theoretical framework proposed by the Intergovernmental Panel on Climate Change (IPCC), and applying it on the urban area of Turin, the fourth most populated Italian urban area.
The UHI-related risk is described in this framework as a combination and interaction of three main factors: hazard, exposure, and vulnerability.
The climate hazard is represented by the UHIs and their distribution within the city boundaries; exposure refers to the presence of vulnerable citizens in urban areas who are likely to be adversely affected by the occurrence of UHI phenomena: in this case, the population aged 65 or over.
Finally, vulnerability is defined as made up of two factors, sensitivity and adaptive capacity. Sensitivity is composed of the elements which contribute to the susceptibility of the exposed population considered, such as demographic and socioeconomic factors, health conditions and the environmental context of the urbanized area. Adaptive capacity, on the other hand, takes into consideration the availability of facilities and services which contribute to more favorable conditions for individuals under extreme temperatures.
„The combination of all these different factors allows us to express the complexity of the concept of risk associated with Urban Heat Islands,“ said Guglielmo Ricciardi, of CMCC and Politecnico di Torino, another author of the study. „It’s not only greener or more urbanized areas that influence the risk on citizens. We should also consider the characteristics of buildings, the proximity to hospitals, or to public spaces with air conditioning, among others.“
The results were collected in tables and visualized through georeferenced maps for individual and aggregated indicators, and are open access and available under a creative commons license.
The results of the study allowed for the identification of UHIs in the city of Turin, and the associated risk for the population, as well as the priority areas for intervention on a highly detailed scale. While the lowest hazard was measured in green areas corresponding with the main urban parks, thus demonstrating the significant contribution of vegetation to heat reduction, higher-risk zones are mostly located in the densely populated areas of the suburbs.
„A strength of this work is that such a high-resolution analysis of the connection between the UHI hazard, the population exposure, and the related vulnerabilities at the urban level is still uncommon,“ said Ellena, „and we hope it will be used by policymakers for informed decisions and adaptation measures, or by other researchers as a guidance to reproduce similar analyses in other Italian (and not Italian) urban contexts.“
Paper: Marta Ellena et al, Micro-scale UHI risk assessment on the heat-health nexus within cities by looking at socio-economic factors and built environment characteristics: The Turin case study (Italy), Urban Climate (2023). DOI: 10.1016/j.uclim.2023.101514