
Kein Sommer auf der Nordhalbkugel, bei denen es keine Aufregung um Hitzewellen gibt. So auch im Jahr 2023. Das Thema bietet sich geradezu an, wenn es warm oder gar heiß ist. Die Frage sollte allerdings eher sein, wie eine Hitzewelle einzuordnen ist. Ein Artikel in der Washington Post stellt die These auf, dass es ohne den Klimawandel Hitzewellen, wie sie Teile der USA und auch Europas aufweisen, nicht möglich gewesen wären. Man hätte sie gar nicht bemerkt.
“The deadly, protracted heat waves that have scorched parts of North America and Europe this month would have been “virtually impossible” without climate change, according to a new study published Tuesday. The analysis by the World Weather Attribution network, a coalition of scientists that conducts rapid analyses to determine how the warming atmosphere influences extreme weather events, examined weather data and computer model simulations to compare the climate as it is today, having experienced warming of about 1.2 Celsius (2.2 Fahrenheit) since the late 1800s, with the climate of the past. The results came with a sobering reminder: Once unfathomable heat waves are not only happening, but becoming more common. “They are not rare in today’s climate,” Friederike Otto, co-leader of the group and a climate scientist at Imperial College London, said in an interview. “What surprises me is that people are so surprised. It is exactly what we expected to see.””
Der Artikel beruft sich auf eine Studie, an der die deutsche Attributionsforscherin Friederike Otto beteiligt war. Die Studie selbst ist noch nicht durch ein Peer-Review gegangen. Wir blicken noch einmal kurz zurück in das Jahr 2021. Eine Hitzewelle im Nordwesten der USA und dem Südosten Kanadas beschäftigte die Menschen und die Medien. In einem Artikel haben wir seinerzeit einige Fakten zu dem Thema zusammengetragen. Wie die neue Studie die Zeit der 1930er Jahre in den USA allerdings schlüssig erklären will, das dürfte spannend werden. Vor allem der Hitzewellen-Index der US-Umweltschutzbehörde EPA ist in diesem Zusammenhang interessant, auch wenn die Abbildung 2021 endet.
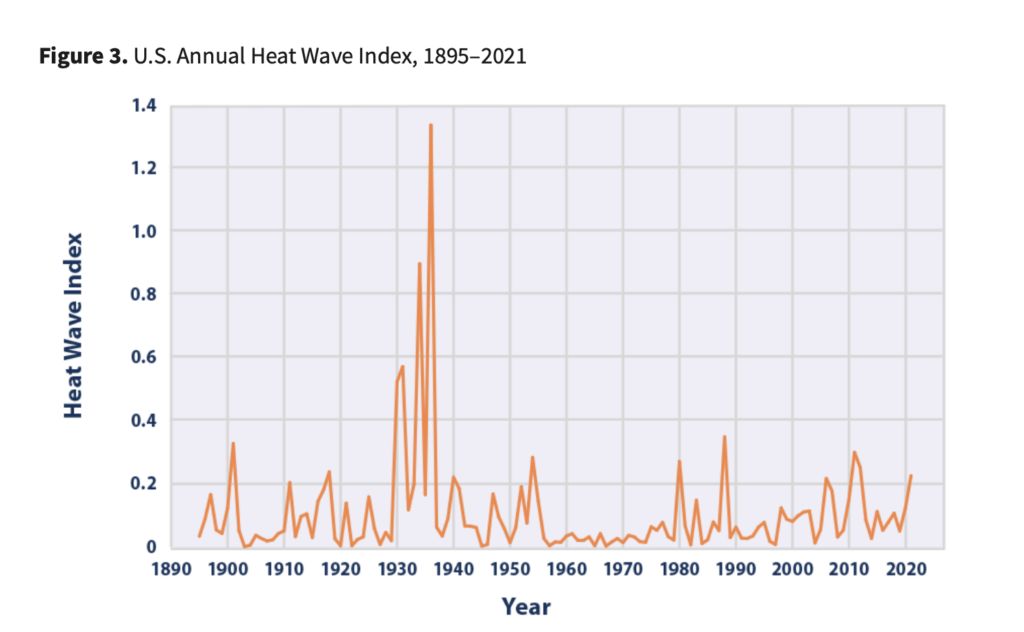
(Abbildung: Screenshot EPA)
Betrachtet man nur die Zeit ab 1960, so wie die EPA das in anderen Bereichen macht, sieht die Entwicklung in der Tat dramatisch aus, denn das war eine Talsohle in Sachen Hitze.
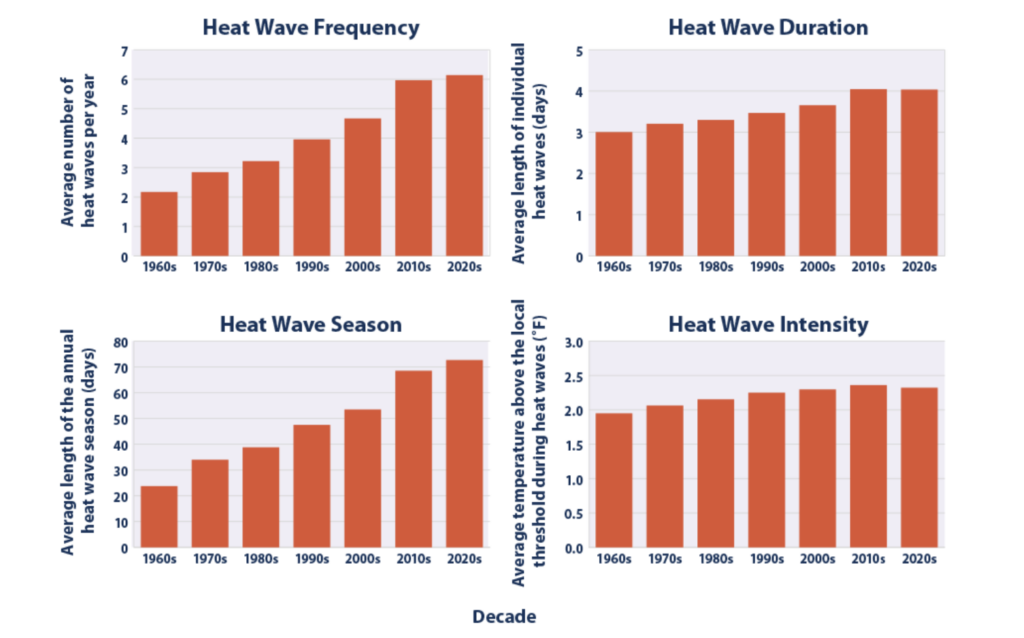
(Abbildung: Screenshot EPA)
Ob es an mangelnden Daten liegt, dass die Zeit vor 1960 nicht beachtet wurde? Spannend wäre es allemal. Aber noch etwas an dem Artikel ist interessant. Klima-Phänomene wie El Niño spielen demnach keine Rolle bei den Temperaturen. Vielleicht stören sie die These nur, genau wie der Wasserdampf-Eintrag beim Vulkan Ausbruch von Hunga Tonga (wir berichteten). Wenn man also konsequent natürliche Antriebe ignoriert, dann bleibt am Ende nicht mehr viel als Erklärung.
“The researchers behind Tuesday’s study said they did not specifically examine the role of the El Niño climate pattern that has developed this summer and is known to boost temperatures and alter weather patterns. But they said that climate models do account for such variations, and that whatever role El Niño plays in land-based heat waves pales in comparison to that of the warming atmosphere. “Although the El Niño feeds into the numbers, the signal remains the same,” said Mariam Zachariah, a researcher at Imperial College London and a study co-author. “The climate change signal is still evident.””
+++
Wie schaut die deutsche Gesellschaft derzeit auf die Klimabewegung? Eine Umfrage aus dem Mai 2023 wurde jetzt bei More in Common veröffentlicht. Sie sieht eine Abnahme der Unterstützung, auch wegen der “Letzten Generation”. Die Aktion erreicht also genau das Gegenteil von dem, was sie erreichen möchte.
“Derzeit urteilen 85 Prozent der Befragten, dass die Klima- und Umweltbewegung „häufig mit ihren Protestaktionen zu weit“ geht, und zwar mit breiten Mehrheiten in allen gesellschaftlichen Typen. Zum Vergleich: Im Jahr 2021 sagte dies lediglich rund die Hälfte der Befragten – und zwar mit großen Unterschieden zwischen eher unterstützenden und eher kritischen Segmenten. Heute herrscht dagegen eine neue Einhelligkeit beim Negativurteil. Wenn wir Menschen dann konkret fragen, ob sie eigentlich eher Verständnis oder kein Verständnis für die Straßenblockaden der „Letzten Generation“ haben, äußern nur 8 Prozent Verständnis. 85 Prozent reagieren mit Unverständnis. Und das obwohl in unseren (zusätzlich durchgeführten) qualitativen Forschungsgesprächen viele Menschen die grundsätzliche Notwendigkeit von starken Aktionen für den Klimaschutz durchaus anerkennen, und die Straßenblockaden auf dieser Ebene teils verteidigen! Es ist vielen Menschen möglich, die konkreten Proteste in ihrer Machart abzulehnen und dennoch um die Bedeutung von Klimaengagement zu wissen. ”
+++
Letztes Jahr hat John Clauser den Nobelpreis für Physik erhalten. Jetzt äussert sich der Amerikanier massiv klimaskeptisch. Bei der Klimaforschung handle es sich um Pseudowissenschaft. Alex Reichmuth ist dem Fall im Nebelspalter nachgegangen.
Physik-Nobelpreisträger bezeichnet Klimaforschung als Pseudowissenschaft
«Das populäre Narrativ über den Klimawandel spiegelt eine gefährliche Korruption der Wissenschaft wider, welche die Weltwirtschaft und das Wohlergehen von Milliarden Menschen bedroht.» Das sagt nicht irgendein inkompetenter «Klimaleugner», sondern John Clauser, amerikanischer Physiker und Gewinner des Nobelpreises 2022. Gemäss Clauser hat sich die «fehlgeleitete Klimawissenschaft» in eine «massive schockjournalistische Pseudowissenschaft» verwandelt. Es gebe aber keine echte Klimakrise. Vielmehr werde die steigende CO₂-Konzentration in der Atmosphäre der Welt zugutekommen.
Mehr dazu lesen im Nebelspalter.
+++
Two NASA studies find lower methane emissions in Los Angeles region
Researchers found that emissions of the powerful greenhouse gas dropped for several years near the nation’s second-largest metropolitan area.
Two recent studies by researchers at NASA’s Jet Propulsion Laboratory in Southern California used contrasting approaches to measure drops in human-caused emissions of the potent greenhouse gas methane in recent years in the Los Angeles region.
In the first study, published in February in Environmental Research Letters, scientists analyzed data from ground-based sensors scattered around four counties in densely populated Southern California: Los Angeles, Orange, San Bernardino, and Riverside. They found emissions fell by about 7% between 2015 and 2020—a reduction of 33 million pounds (15 million kilograms) of methane released per year.
The second study, published in March in Environmental Research Communications, compared emissions from a belt of oil refineries across the South Bay area of Los Angeles during the first summer of the COVID-19 pandemic to those observed three years earlier. Using data from a NASA airborne instrument, researchers saw that most of the facilities they identified as methane sources in the earlier campaign were no longer emitting the greenhouse gas, leading to a 73% reduction in measured emissions. While such a reduction around COVID disruptions was not necessarily surprising, the result was important for demonstrating scientists‘ ability to track point sources of methane.
Methane has a much shorter atmospheric lifespan than carbon dioxide—around 12 years, compared to centuries for carbon dioxide—but it absorbs much more energy while it exists in the atmosphere. Therefore, reducing human-caused emissions of the gas is a particularly effective way to make significant, short-term impacts on global climate change.
„These papers demonstrate that methane reductions are not only possible, they’re measurable through persistent monitoring,“ said Andrew Thorpe, lead author of the COVID-period study and a JPL research technologist.
That two studies could use different techniques to identify and quantify emissions trends is crucial for generating confidence in the conclusions drawn from methane observations, added Vineet Yadav, a JPL data scientist and lead author of the first paper.
„The important thing is to determine whether emissions are increasing or declining, and for that it’s helpful to have more than one approach,“ said Yadav, whose study employs two techniques. „If you are turning the information over to decision-makers, you have to be sure.“
Focusing on the region
Yadav’s paper is based on measurements from eight spectroscopic sensors that were installed as part of the Megacities Carbon Project, a multiagency collaboration currently monitoring greenhouse gases in the Los Angeles, Indianapolis, and Washington areas. The sensors have been gathering data across a large swath of Southern California since 2015 and enabled researchers to study an area that stretches from the beaches of Malibu in the west to the mountains and deserts of San Bernardino and Riverside counties in the east. It also extends south through all of Orange County.
The researchers found that month-to-month fluctuations in methane concentrations measured at each sensor tower gradually fell from 2015 to 2020 and well into 2022—a strong indication that local emissions of the gas were also decreasing. Then, using a mathematical model to estimate the emissions decrease, Yadav and colleagues found the areas covered by the Granada Hills and Ontario sensors accounted for much of the drop in annual emissions from 2015 to 2020.
Although the paper doesn’t cite causes of the emission reductions in those two locales, Yadav suspects they resulted from better management of natural gas pipelines and equipment, which in turn led to lower fugitive—or accidental—methane releases. Improved infrastructure at a massive waste site near Granada Hills likely also played a role.
Focusing on refineries
Rather than analyzing data from ground sensors, the study focusing on oil refineries uses measurements made by an imaging spectrometer called AVIRIS-NG (Airborne Visible/Infrared Imaging Spectrometer-Next Generation). Attached to the bottom of an aircraft, the instrument can detect greenhouse gas emissions from individual facilities or even pieces of equipment by looking at how the gases absorb sunlight.
In 2016 and 2017, AVIRIS-NG was flown over 22,000 square miles (57,000 square kilometers) of the state as part of the California Methane Survey. From July to September 2020, researchers retraced some of those flight paths over refineries and power plants in Los Angeles County and over oilfields in central California’s San Joaquin Valley.
The 2020 surveys over Los Angeles identified only 11 plumes from five refinery sources, with a total emissions rate of about 712 pounds (323 kilograms) of methane per hour. The 2016 and ’17 flights had found 48 plumes from 33 sources, with a total emissions rate of roughly 2,639 pounds (1,197 kilograms methane) per hour.
The drop correlates with an 18% decrease in monthly production in Southern California refineries between the two flight campaigns, the scientists noted, citing data from the California Energy Commission. The study also found that emissions from oilfields in and around the city of Bakersfield in central California fell 34.2%, correlating with a 24.2% drop in oil production.
Thorpe said that reduced production during the pandemic due to lower demand for fuel and depressed oil prices could have led to the drop in methane emissions, as oilfields and refineries emitted less methane during operations. However, he added, improved equipment maintenance and mitigation efforts at those facilities between 2016 and 2020 can’t be ruled out as a factor.
The National Oceanic and Atmospheric Administration’s estimate of global atmospheric methane concentration accelerated after 2020, „underscoring the critical need to reduce emissions,“ Thorpe writes in the paper. Being able to accurately detect and measure emissions is a key step, both he and Yadav said.
Papers:
Vineet Yadav et al, A declining trend of methane emissions in the Los Angeles basin from 2015 to 2020, Environmental Research Letters (2023). DOI: 10.1088/1748-9326/acb6a9
A K Thorpe et al, Methane emissions decline from reduced oil, natural gas, and refinery production during COVID-19, Environmental Research Communications (2023). DOI: 10.1088/2515-7620/acb5e5